Figure 3.

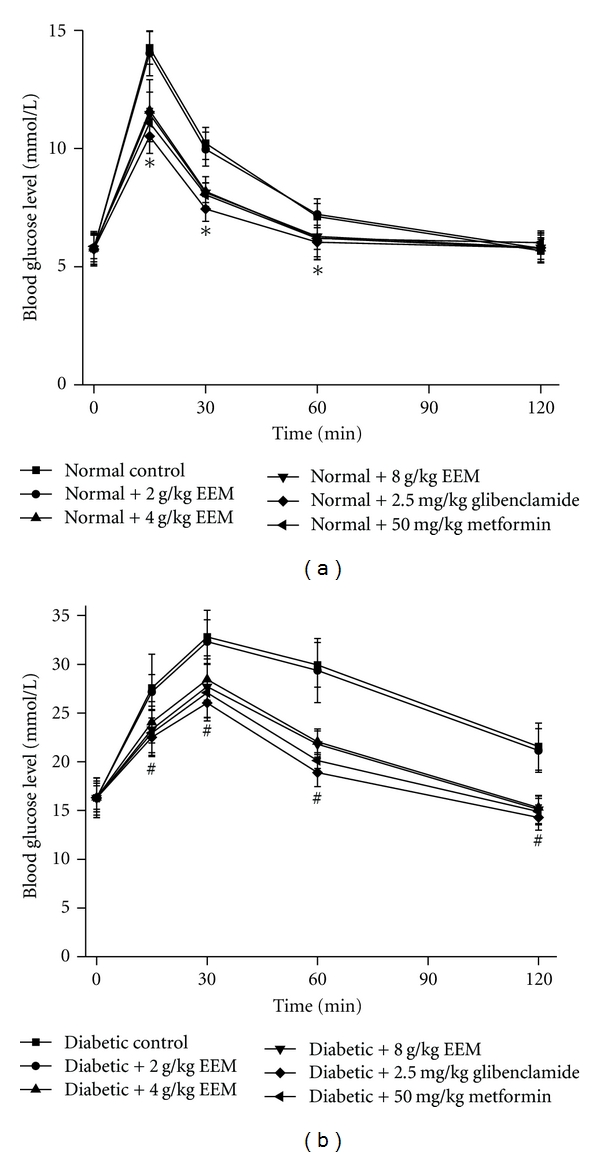
Effects of EEM on oral glucose tolerance test in normal and diabetic mice. Data are expressed as mean ± SD, n = 10 mice per group. *P < 0.01, compared to normal control. # P < 0.01, compared to diabetic control.

Effects of EEM on oral glucose tolerance test in normal and diabetic mice. Data are expressed as mean ± SD, n = 10 mice per group. *P < 0.01, compared to normal control. # P < 0.01, compared to diabetic control.