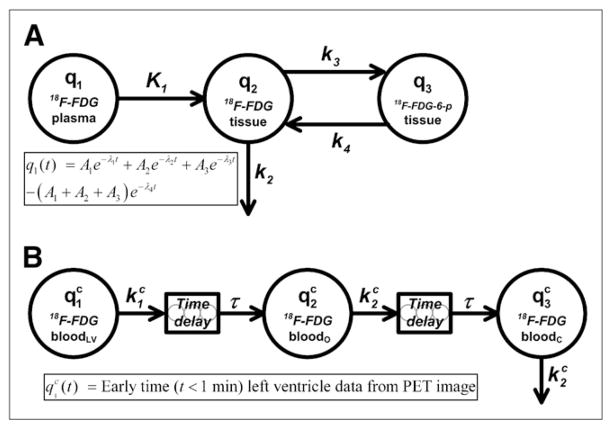
FIGURE 1.
(A) 4K open-loop model describing 18F-FDG tissue uptake and metabolism. Left-hand compartment (q1) represents input (forcing) function described by sum of 4 exponential terms, center compartment (q2) represents extravascular 18F-FDG in organ space, and right-hand compartment (q3) represents phosphorylated 18F-FDG in organ space. Measurement model (Eq. 5) is defined as total amount of 18F-FDG and 18F-FDG-6-phosphate (18F-FDG-6-p) in organ space. (B) Compartmental model for partial-volume, delay, and dispersion corrections of early portion (t < 60 s) of LV time–activity curve. Left-hand compartment ( ) represents forcing function defined by LV time–activity curve obtained from reconstructed PET image at early times (<1 min), and center ( ) and right-hand ( ) compartments represent arterial concentrations of 18F-FDG in organ (o) and femoral artery catheter (c) sites, respectively. Two delay components, modeled as string of 5 compartments with fast mass transfer rates, are included to account for time it takes drug to travel from LV to organ and catheter sites. Superscript c indicates that these are model equations used for correction of early-time LV data.

