
Figure 7.
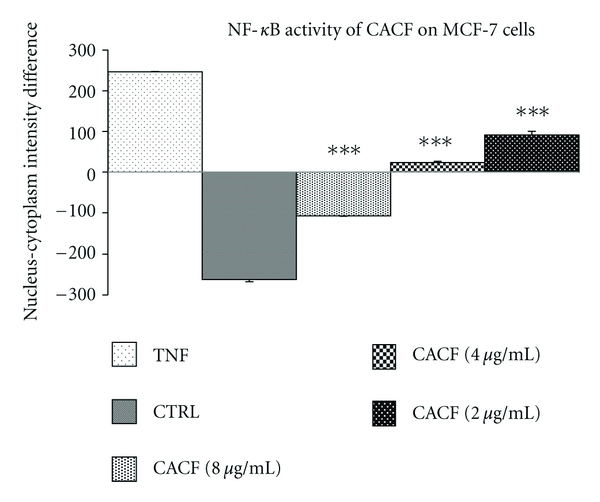
Dose-response histogram of CACF treated MCF-7 cells for 1 hours and then stimulated for 30 minutes with 10 ng/mL TNF-α for quantitative image analysis of intracellular targets.
Official websites use .gov
A
.gov website belongs to an official
government organization in the United States.
Secure .gov websites use HTTPS
A lock (
) or https:// means you've safely
connected to the .gov website. Share sensitive
information only on official, secure websites.
Dose-response histogram of CACF treated MCF-7 cells for 1 hours and then stimulated for 30 minutes with 10 ng/mL TNF-α for quantitative image analysis of intracellular targets.