
Figure 1.
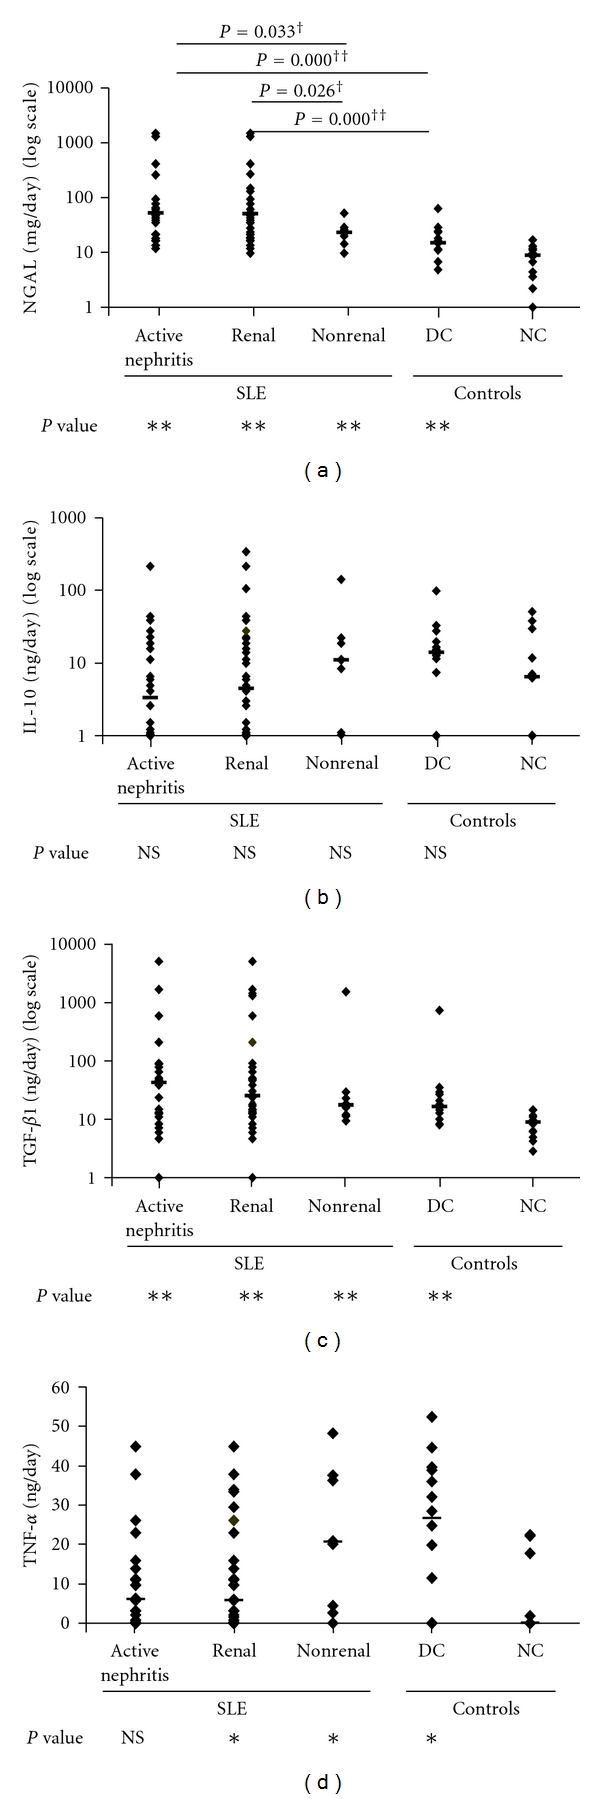
Comparison of 24-hour urinary excretion of neutrophil gelatinase-associated lipocalin (NGAL) (a), interleukin (IL)-10 (b), transforming growth factor (TGF)-β1 (c), and tumor necrosis factor (TNF)-α (d) in 5 groups: systemic lupus erythematosus (SLE)-active nephritis (n = 24), SLE-renal (24 SLE-active nephritis + 10 SLE-proteinuria only, n = 34), SLE-non-renal (n = 8), disease control (DC, n = 14), and normal control (NC, n = 12) groups. †P < 0.05 and ††P < 0.01, are shown above panels, for comparison among the different patient groups. *P < 0.05, **P < 0.01, and NS, not significant, are shown below the x-axis of panels, in comparison with the NC group. The median value in each study group is shown by a horizontal line.