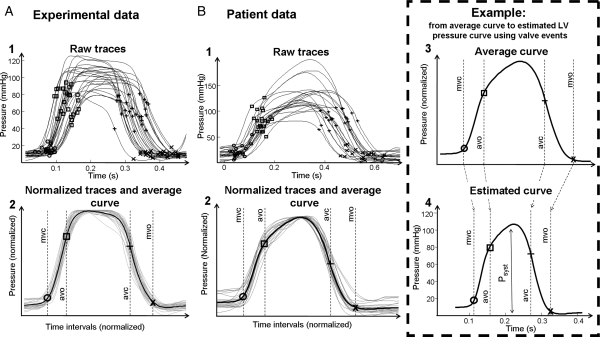
Figure 1.
Estimation of left ventricular pressure curve. (A, 1) Raw left ventricular pressure data from dogs used for creating a profile of the reference pressure waveform, consisting of pressure recordings under different haemodynamic situations. Timing of mitral and aortic valve events is indicated. (A, 2) The raw pressure waveforms (grey curves) have been stretched or compressed along the time axis between individual valve events in order to make the valvular events coincide for all recordings. The waveforms have also been vertically scaled to have the same peak value. The averaged waveform to be used for predicting pressure traces is indicated by the black curve. (B, 1 and 2) Patient data: estimation of average pressure waveform as described in (A, 1) and (A, 2). (B, 3) The averaged waveform with arbitrary time intervals, transferred from (B, 2). (B, 4) Prediction of the left ventricular pressure waveform is based on the timing of valvular event. The left ventricular pressure waveform is constructed by adjusting the duration of time intervals to match the actual valvular timing as determined by echocardiography in the specific subject. In addition to the time-axis adjustments, the waveform has been scaled according to systolic arterial cuff pressure.

