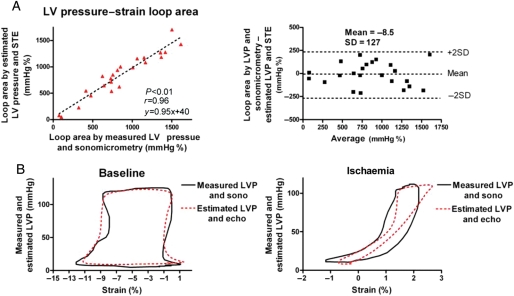
Figure 3.
(A) Correlation and agreement between area of the pressure–strain loops by estimated left ventricular pressure and speckle tracking echocardiography vs. measured left ventricular pressure and sonomicrometry. (B) Representative traces showing pressure–strain loops by left ventricular pressure and sonomicrometry (black line) vs. estimated left ventricular pressure and echocardiography (red dotted line). Measurements during baseline (left panel) and ischaemia (right panel). Sono, sonomicrometry; echo, speckle tracking echocardiography.

