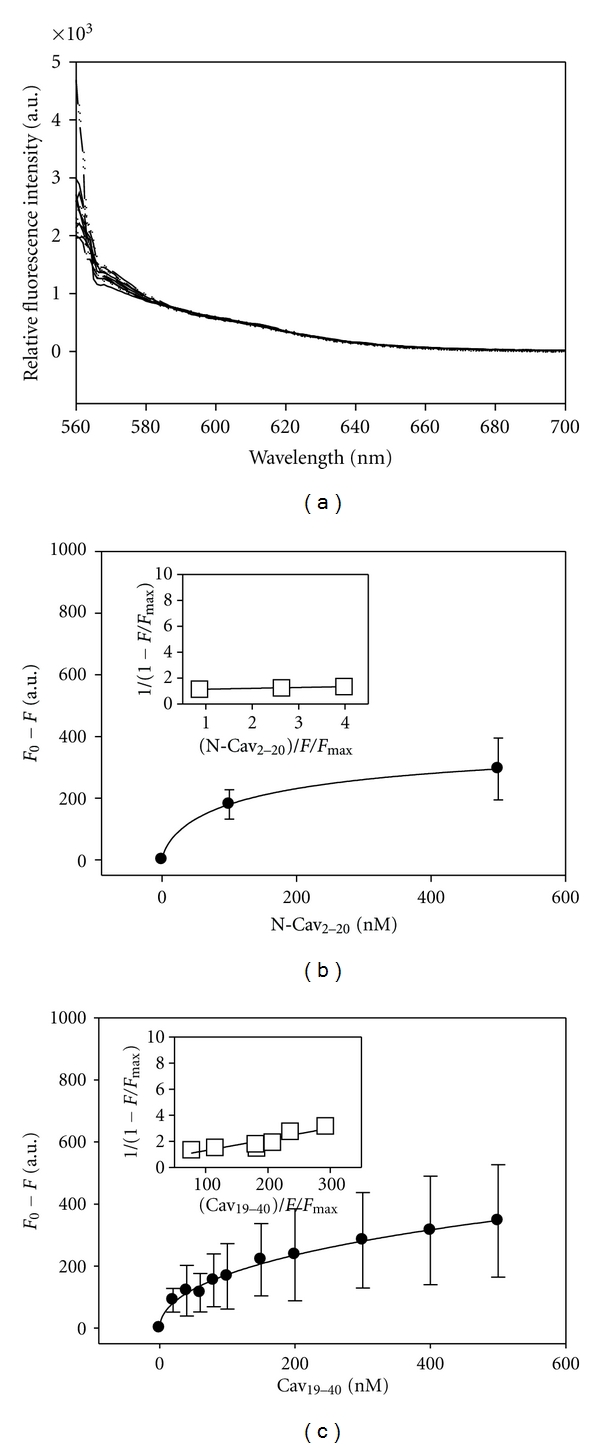
Figure 3.

Direct Fluorescence-Binding Assays of N-Cav2-20 or N-Cav19-40 Peptide with C-Cav161-178 Peptide. (a) Fluorescence spectra of Cy3-C-Cav161-178 titrated with increasing concentrations of Cav19-40 (0–500 nM). (b-c) Plots of maximal fluorescence emission (measured at 565 nm upon excitation at 550 nm) for (b) N-Cav2-20 and (c) N-Cav19-40 in the presence of 100 nM Cy3-C-Cav161-178. Insets: linear plots of the binding curve of (b) N-Cav2-20 and (c) N-Cav19-40.
