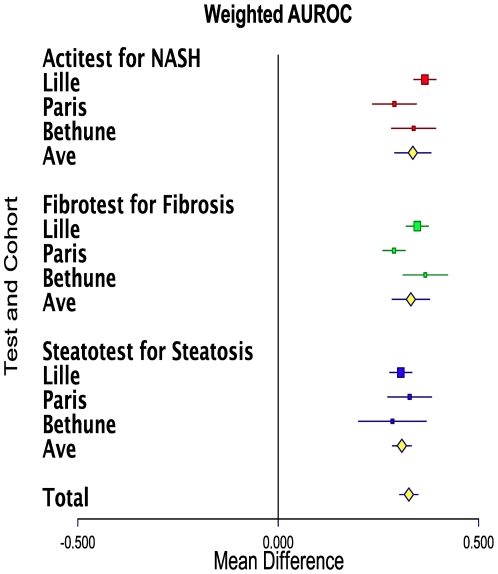
Figure 3. Meta-analyses of 3 studies of biomarkers accuracy (Obuchowski measure: weighted area under the ROC curve [wAUROC]) for the diagnostic of liver injury in patients with severe obesity.
FibroTest for the diagnosis of advanced fibrosis (at least equivalent to METAVIR score F2). SteatoTest for the diagnosis of advanced steatosis (>30% steatosis). ActiTest for the diagnosis of NASH (NAS score >4). The horizontal lines indicate the 95% confidence interval for the mean difference between between test's wAUROCs and random (0.500). The vertical lines indicate the equivalence line (0% difference). Positive differences indicate a difference in favor of test). When the horizontal line crosses the vertical line, there is no significant difference. Ave = Average of AUROCs.

