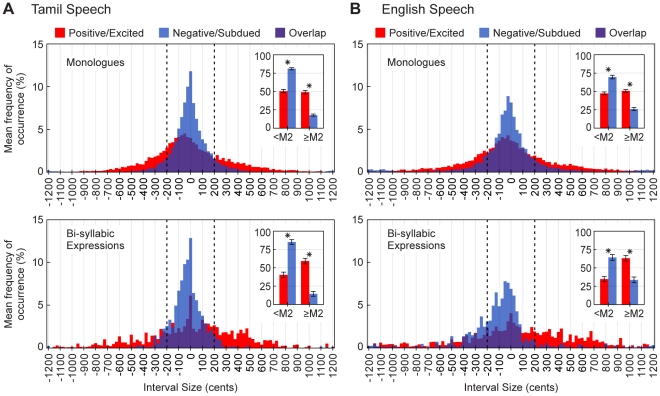
Figure 5. Distributions of prosodic interval sizes in Tamil and English speech expressing different emotions.
(A) Overlays of the average distributions of prosodic interval sizes in positive/excited (red) and negative/subdued (blue) Tamil speech (purple shows overlap). The top and bottom panels show data for the monologue and bi-syllabic recordings respectively. Insets compare the mean percentages of prosodic intervals smaller and larger than a major second (dashed lines separate these groups). Error bars indicate ±2 SEM. Asterisks indicate statistically significant differences between the underlying distributions (*P<0.05; Mann-Whitney U-tests; see Figure S4 for complete statistics). (B) Same as (A), but for English speech.

