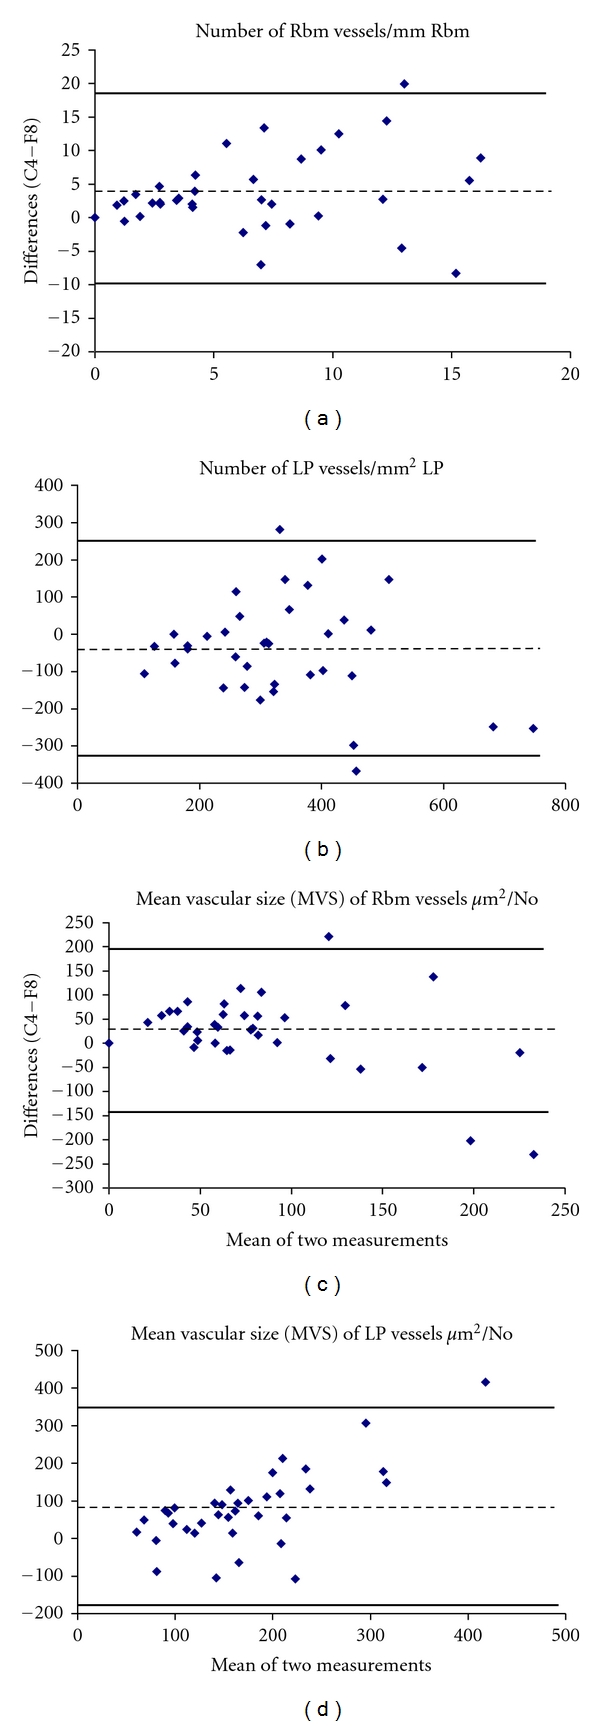
Figure 2.

Bland and Altman plots for number of vessels and mean vascular size (MVS) in the reticular basement membrane (Rbm) and lamina propria (LP) in all study subjects together. Bland and Altman plots illustrate agreement between the two methods of vessel staining with anti-Factor VIII and anti-Collagen IV antibodies. Values on the X axis represent means of the two measurements; values on the Y axis indicate measurements with Collagen IV staining minus measurements with Factor VIII staining (C4-F8). The broken line represents the mean difference. Bold lines indicate Limits of agreements (mean of differences ±2 standard deviations). C4: anti-Collagen IV; F8: anti-Factor VIII.
