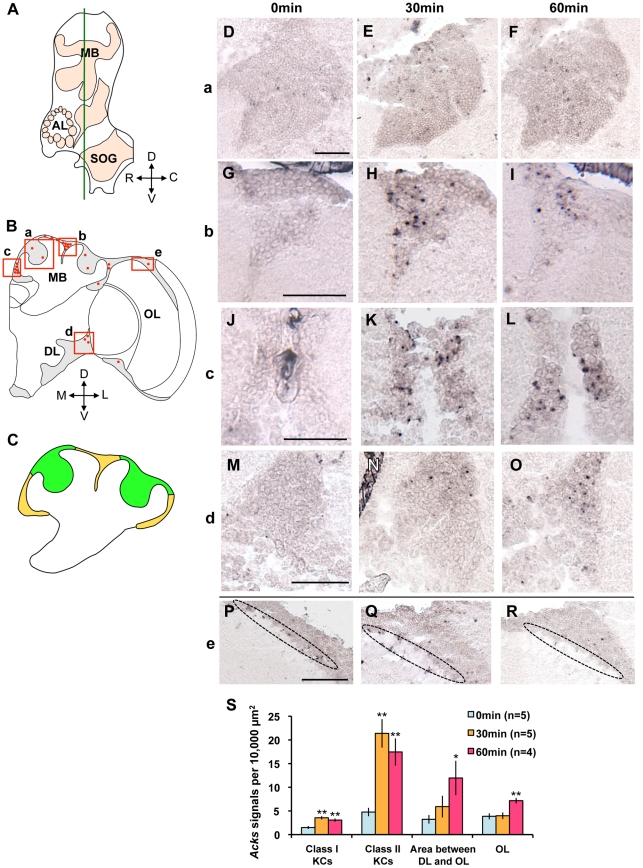
Figure 4. Neural activity in the middle part of the brain during bee ball formation.
(A) Schematic diagram of the lateral view of a bee brain. The green line indicates the position of sections that correspond to a middle part of the brain used for this in situ hybridization experiment. (B) Schematic representation of the Acks signals detected in the right brain hemisphere of the workers that formed the bee ball. The red dots indicate induced Acks signals at 30 or 60 min after the bee ball formation. The boxed regions (a–e) correspond to the Class I KCs whose somata are located inside the calyces (a), parts of the Class II KCs whose somata are located outside of calyces (b and c), the restricted area located between the DL and lobula of the OL (d), and a part of the OL (e), whose in situ hybridization results are presented in the right panels (D–R). (C) Magnified schematic representation of the MB indicating the distribution of the somata of the Class I (green) and the Class II KCs (yellow), respectively. (D–R) In situ hybridization of Acks in each brain area shown in (B) in the brains of workers at 0 (D, G, J, M, and P), 30 (E, H, K, N, and Q) and 60 min (F, I, L, O, and R) after the bee ball formation. (D–F), (G–I), (J–L), (M–O), and (P–R) correspond to the boxed brain regions (a), (b), (c), (d), and (e), respectively. The dotted Acks signals were detected most densely in the Class II KCs (H, I, K, and L), and less densely in the Class I KCs (E and F) at 30 and 60 min after the bee ball formation, respectively. Note that the Acks signals were detected moderately in the restricted region between the DLs and the lobula of the OLs (O), and less densely in the OLs (R) at 60 min after the bee ball formation. Staining observed in area surrounded by dotted ellipse (P–R) represents non-specific staining of trachea, which was also observed in sections hybridized with the sense probe (data not shown). Bars indicate 50 µm. (S) Quantification of Acks-positive cells in various brain regions. Values are means ± SEM. Asterisks indicate significant difference compared to that at 0 min (*, P<0.05; **, P<0.01; Dunnett's test).

