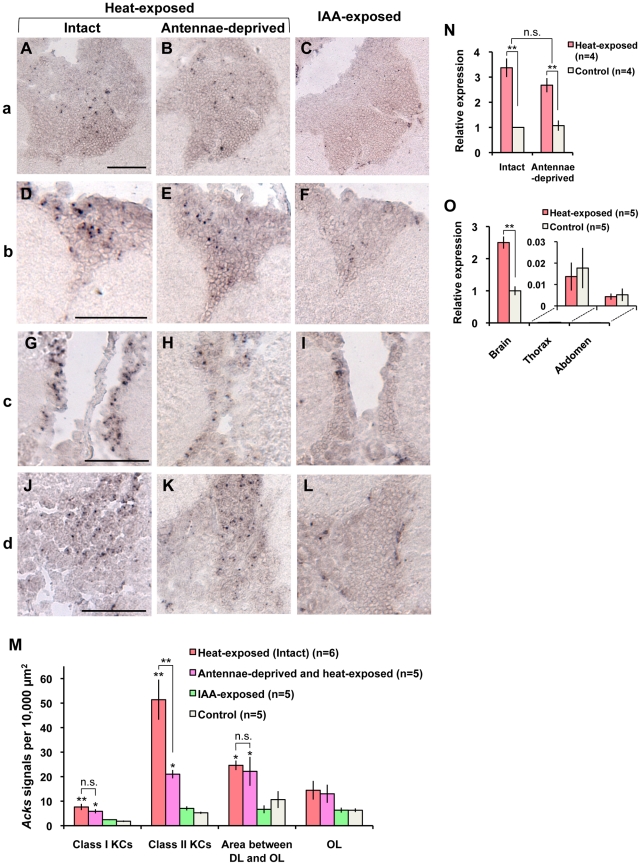
Figure 5. Neural activity in the brains of workers exposed to high temperature or IAA.
(A–L) In situ hybridization of Acks in each brain area shown as Figure 4B in the brains of workers exposed to 46°C heat (A, D, G, and J), workers whose antennae are deprived before heat-exposure (B, E, H, and K), and workers exposed to IAA (C, F, I, and L). (A–C), (D–F), (G–I), and (J–L) correspond to the boxed brain regions shown as in Figure 4B (a), (b), (c), and (d), respectively. In the brains of heat-exposed bees, the dotted Acks signals were detected most densely in the Class II KCs (D and G) and moderately in the restricted area between the DLs and OLs (J), and much less densely in the Class I KCs (A), whereas there was some decrease in the Acks signals in the Class II KCs of antennae-deprived and heat-exposed workers (E and H). On the other hand, scarce or no significant signals were detected in these brain regions in IAA-exposed workers (C, F, I, and L). Bars indicate 50 µm. (M) Quantification of Acks-positive cells in various brain regions. Values are means ± SEM. Asterisks indicate significant difference compared to control (*, P<0.05; **, P<0.01; Dunnett's test). Student's t-test was used to compare heat-exposed intact and heat-exposed antennae-deprived workers (n.s. = non-significant; **, P<0.01). (N) The results of quantitative RT-PCR showing the Acks expression in the MBs of intact and antennae-deprived workers under usual (33°C) and high (46°C) temperature. Each experimental group contained four lots of workers. A two-way ANOVA revealed that there was no interaction between temperature and ablation of antennae (n.s. = non-significant, P = 0.15), and then Student's t-test was conducted for intergroup comparison (**, P<0.01). Values are means ± SEM. (O) The results of quantitative RT-PCR showing Acks expression in the brain, thorax, and abdomen of heat-exposed intact workers. Asterisks indicate a significant difference between heat-exposed and control workers within the same tissues (**, P<0.01; Student's t-test). The results for the thorax and abdomen are shown in the magnified graph because these values were extremely low. Values are means ± SEM.

