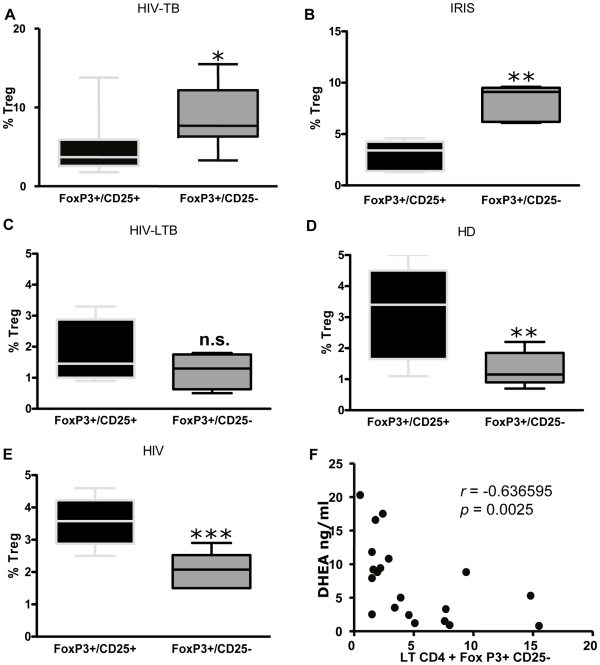
Figure 4. Expanded “non-conventional” Treg in HIV-TB and IRIS patients.
Analysis of CD4+FoxP3+CD25+ and CD4+FoxP3+CD25- populations within Treg in A; HIV-TB (n = 11), B; IRIS (n = 5), C; HIV-LTB (n = 4), D; HD (n = 10) and E; HIV (n = 7) individuals. Horizontal lines inside the boxes indicate the means ± SEM of each group. Asterisks denote comparisons between each sub-population. *: p < 0.05; **: p < 0.01; ***: p< 0.001. F. Spearman correlation analysis between plasma DHEA and the percentage of CD4+FoxP3+CD25- lymphocytes from all grouped patients (HIV+, HIV-TB, IRIS, HIV-LTB and HD). Results of statistical analysis are shown in the graphic.

