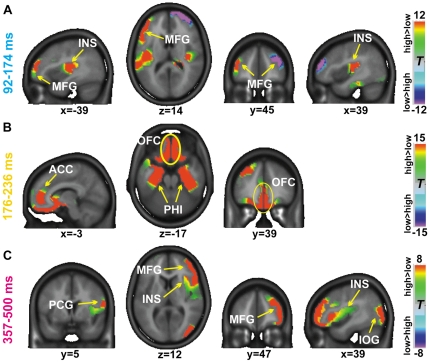
Figure 3. LAURA source estimations.
Statistical contrasts of LAURA source estimations computed for taste stimuli when preceded by high-calorie versus low-calorie images. Time periods were obtained from the topographical cluster analysis. Color scales represent t-values with positive values indicating stronger activity during taste perception preceded by high-calorie than low-calorie images and negative values indicating increased activity when taste was preceded by low- as compared with high-calorie images. MFG = middle frontal gyrus, INS = insula, ACC = anterior cingulate cortex, OFC = orbitofrontal cortex, PHI = parahippocampal gyrus, PCG = postcentral gyrus, IOG = inferior occipital gyrus.

