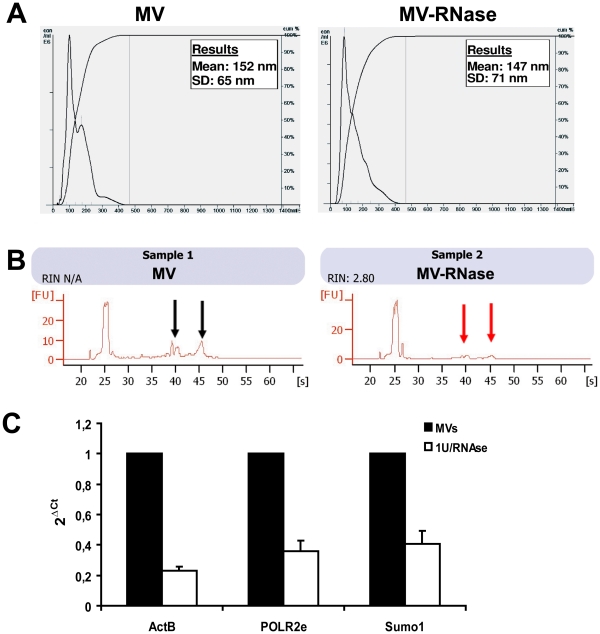
Figure 6. RNase treatment does not modify MV size, but reduces RNA content of MVs.
A) Representative MV size analyses by direct measurement with NTA, showing no difference among MVs treated or not with RNase. B) Representative Bioanalyzer profile, showing the size distribution of total RNA extracted from MVs treated or not with RNAse. The first peak (left side of each panel) represents an internal standard. The two peaks in Sample 1 (black arrows) represent 18 S (left) and 28 S (right) ribosomal RNA, only partially detectable in MVs. The red arrows showed the reduction of 18 and 28 S fragment inside RNAse-treated MVs. C) Histogram showing the expression level of SUMO-1, POLR2 and Act B transcripts in MVs treated or not with RNase, express as 2-δCt, as described in material and methods.

