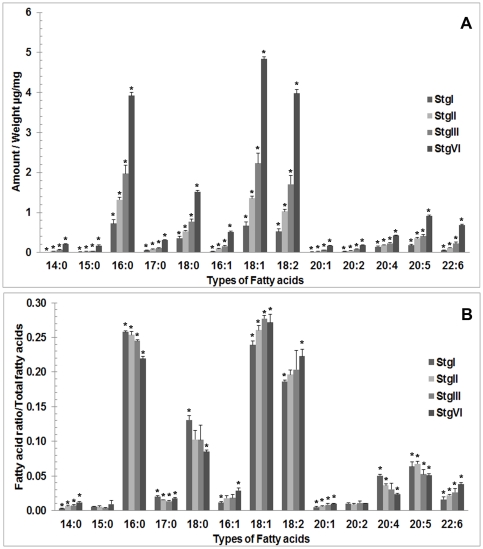
Figure 3. Histograms showing the average amount of each fatty acid (FA) per ovarian weight (µg/mg) (A) and the ratios between each FA per total amount of FAs (B) as detected in each ovarian stage.
The average amounts of all the FAs tended to increase during ovarian development. However, the ratios between each FA per total amount of FA show 3 different patterns during the course of ovarian development. The ratios decreased for FAs 16∶0, 18∶0, 20∶4, and 20∶5; increased for FAs 14∶0, 16∶1, 18∶2, 18∶1, 20∶1, and 22∶6; and remained unchanged for FAs 15∶0, 17∶0 and 20∶2. Significant differences among the 4 stages for each FA were tested by Scheffe's method. The bars show standard deviations, and asterisks show significant difference for each fatty acid. (p<0.05).

