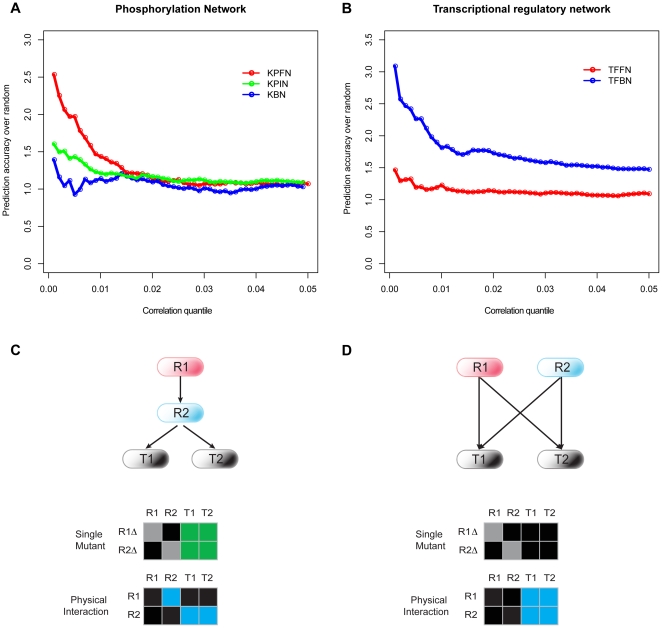
Figure 1. Co-function prediction using different datasets suggests distinct regulatory pattern in phosphorylation network and transcriptional network.
Shown is the fold change of prediction accuracy using different datasets compared with random levels (the fraction of co-function gene pairs in relevant network). (A) Comparison in phosphorylation networks, KPFN (functional network derived from a microarray study of kinase/phosphatase single deletion strains), KBN (biochemical network derived from in vitro protein chip), and KPIN (physical network of kinase/phosphatase interaction). (B) Comparison in transcriptional regulatory networks, TFBN (transcription factor binding network derived from ChIP-chip experiments) and TFFN (functional networks derived from transcription factor single deletion strains). (C) A linear regulatory model. Regulators R1 and R2 function in a linear regulatory pathway, and T1 and T2 are their targets. R1 and R2 share similar profiles in functional network, but disparate profiles in physical network. (D) A parallel regulatory model. Regulators R1 and R2 function in a parallel regulatory pathway, and T1 and T2 are their targets. R1 and R2 share similar profiles in physical network. However, they have no interaction in functional networks due to genetic buffering. Grey: unobserved data; Green: functional interaction; Blue: physical interaction; Black: no interaction.

