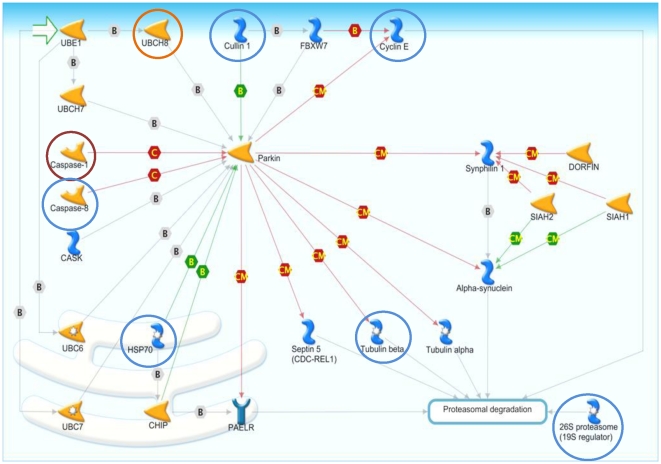
Figure 3. Parkin-Ubiquitin Proteasomal System pathway with viral frequency.
Viral frequencies superimposed for each of most frequently differentially expressed proteins, where red circles are differential expression of genes by 7 viruses, orange circles are differential expression of genes by at least 6 viruses, and blue circles are differential expression of genes by 5 viruses. See MetaCore website at http://www.genego.com/pdf/MC_legend.pdf for figure legend and Table S4 for pathway map gene products' corresponding HUGO gene names.

