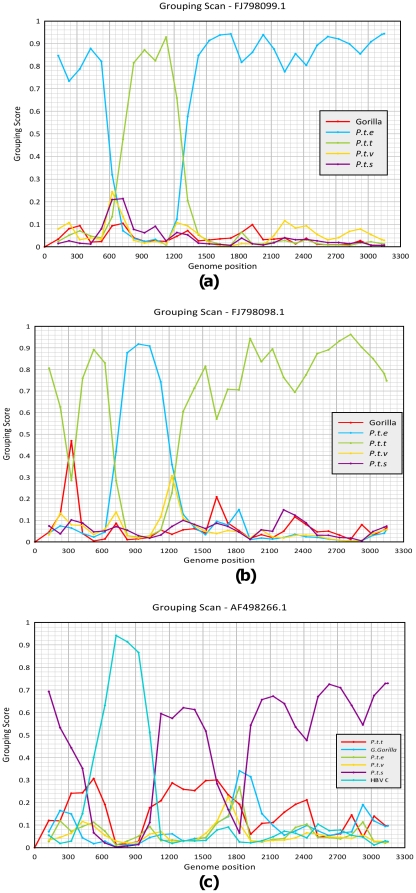
Figure 3. Grouping Scan analysis.
Sequence fragments of 250 bases incrementing by 100 bases with 100 bootstrap replicates, were used to compare and analyse (a) P.t.troglodytes/P.t.ellioti recombinant FJ98098.1 (b) P.t.ellioti/P.t.troglodytes recombinant FJ98099.1 (c) P.t.schweinfurthii isolate A498266; (d) P.t.troglodytes AM117396 (e) P.t.troglodytes recombinant AB046525 (f) study recombinant Gorilla gorilla HBV sequence (ECO50003); to sequence groups from Gorilla gorilla (red), Pan troglodytes ellioti (blue), Pan troglodytes troglodytes (green), Pan troglodytes verus (yellow), Pan troglodytes schweinfurthii (purple) and human genotype HBV/C (light blue) with respect to A498266. Values >0.5 indicate clustering within the indicated group.

