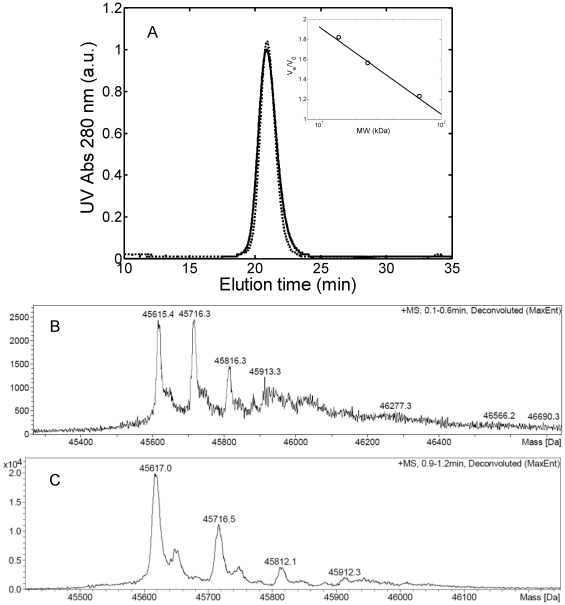
Figure 1. Protein characterization.
(A) SEC chromatogram of 1 g/L light chain solution in 25 mM PBS buffer at pH 7.4 (―) and in 20 mM HCl at pH 2.0 (–). Insertion: calibration curve obtained with bovine serum albumin (60 kDa), chymotrypsinogen A (25 kDa) and lysozyme (14.5 kDa); (B) and (C) Mass spectroscopy analysis in 25 mM PBS buffer at pH 7.4 (B) and in 20 mM HCl at pH 2.0 (C).

