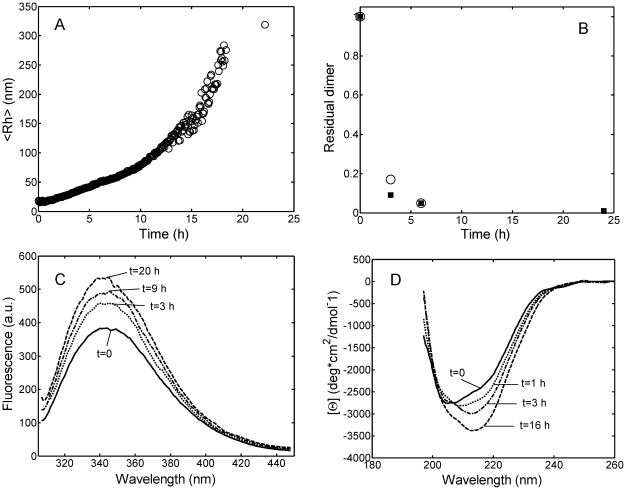
Figure 5. Aggregation kinetics of light chain solution in 20 mM HCl at pH 2.0, T = 37°C, with 0.15 M Na2SO4 (run 8 in Table 1 ).
Time evolutions of (A) the average hydrodynamic radius <Rh>, measured on-line by in situ DLS; (B) residual massive dimer fraction (m) evaluated by SEC (▪) and FFF (○); (C) Intrinsic tryptophan spectra; (D) CD spectra. Experiments were performed at a protein concentration of 1 g/L for (A) and (B) and 0.3 g/L for (C) and (D).

