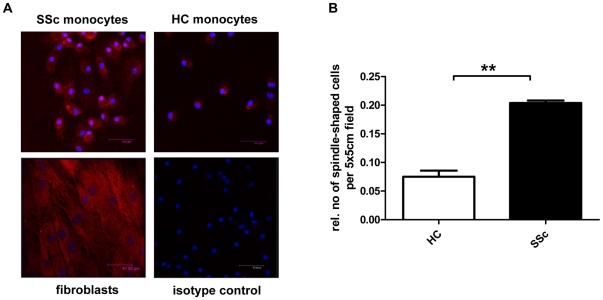
Figure 3. Morphological analysis of monocytes from SSc patients and healthy controls.
A) Immunofluorescence staining of α-SMA (red) in GM-CSF treated monocytes from healthy control or a SSc patient. Fibroblasts were used as positive control. Nuclei were stained with DAPI (blue). For quantification, spindle shaped cells per 5×5 cm field were counted and normalized to cell numbers (B). ** Statistically highly significant (P-value<0.01).

