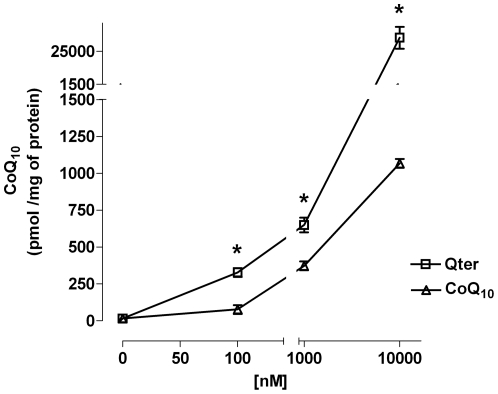
Figure 1. Titration of CoQ10 uptake in H9c2 cells.
H9c2 cells were treated with different concentrations of native CoQ10 or Qter® dissolved in colture medium. After 24 hours cells were carefully washed with PBS and CoQ10 was extracted with exane/ethanol 5∶2 from whole cells and its concentration was determined by HPLC analysis. Data are normalized on total cellular protein content. Values are means ± S.D., n = 3, * p<0.001 vs. native CoQ10 treated samples.

