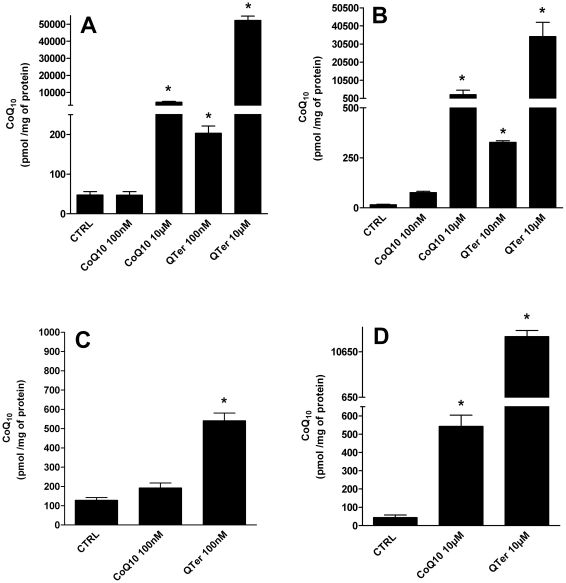
Figure 2. HPLC determination of CoQ10 cellular content.
HPLC determination of CoQ10 cellular content in T67 cells (A) and H9c2 (B) treated for 24 hours with native CoQ10 or Qter® at different concentrations (100 nM and 10 µM). Coenzyme Q10 content was measured also in isolated mitochondria from T67 (C) and H9c2 (D) cells. Data were normalized on total cellular and mitochondrial protein content. Values are means ± S.D., n = 3, * p<0.001 vs. control.

