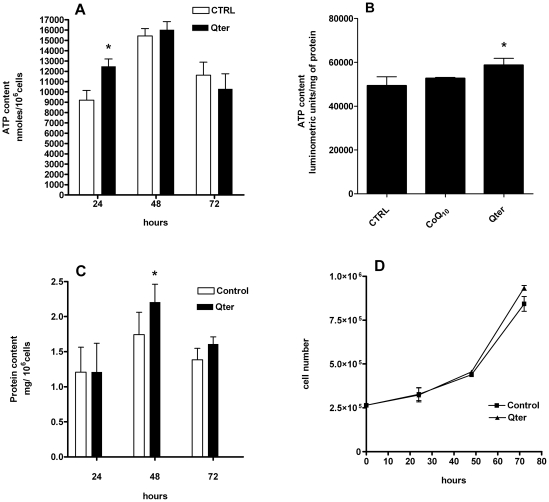
Figure 3. Effect of Qter® treatment on ATP, protein content and cell growth in H9c2 cells.
H9c2 cells were treated up to 72 hours with 100 nM Qter® and the ATP content was measured at 24, 48 and 72 hours by HPLC analysis (A). Panel B shows the intracellular ATP content after 24 hours treatment with 100 nM Qter® or native CoQ10, measured using luminescence ATP detection assay. Data are reported as arbitrary luminometric units and normalized on total protein content. (Values are means ± S.D.,n = 5, * p≤0.01 vs control). H9c2 cells treated with 100 nM Qter up to 72 hours were assayed for protein content at 24, 48 and 72 hours. Protein content was evaluated by Lowry method (C), (Values are means ± S.D., n = 5, * p≤0.05 vs. control). Cell growth was assessed by trypan blue exclusion method (D).

