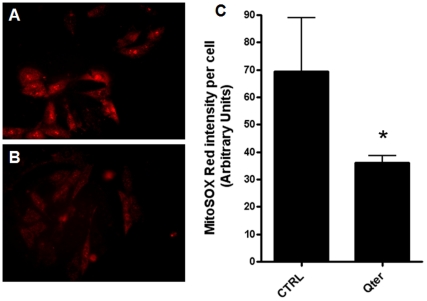
Figure 5. Analysis of physiological mitochondrial superoxide production using MitoSOX Red.
The representative fluorescence images showed the oxidized MitoSOX fluorescence signal in control H9c2 cells (A) and H9c2 cells following 24 treatment with 100 nM Qter® (B). The fluorescence intensity reported in panel C was quantified by Image J software. Values are presented as means ± SD; n = 20. * p≤0.001.

