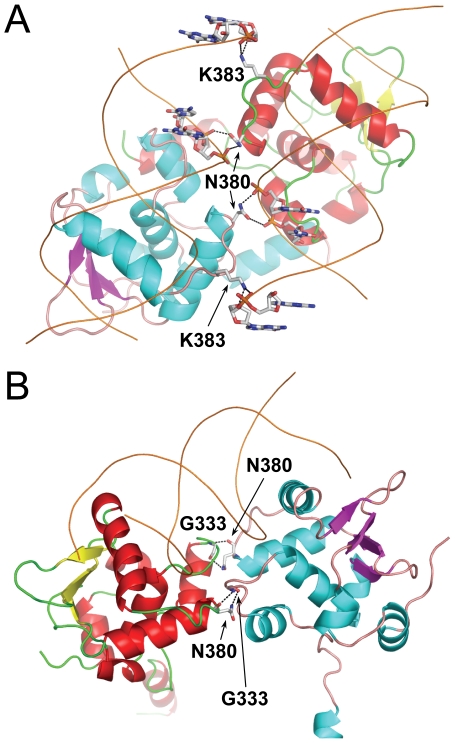
Figure 2. Comparison of intermolecular hydrogen bonds in (Ets1)2•2DNA and (Ets1)2•DNA complexes.
(A) Intermolecular hydrogen bonds between Ets1 and the neighboring DNA duplex within (Ets1)2•2DNA complex. (B) Intermolecular hydrogen bonds between Ets1 subunits in (Ets1)2•DNA complex. In panels A and B Ets1 and DNA molecules are drawn as cartoons and interacting residues are drawn as sticks and labeled. The potential hydrogen bonds are shown as dotted lines. The color codes are as in Figure 1.

