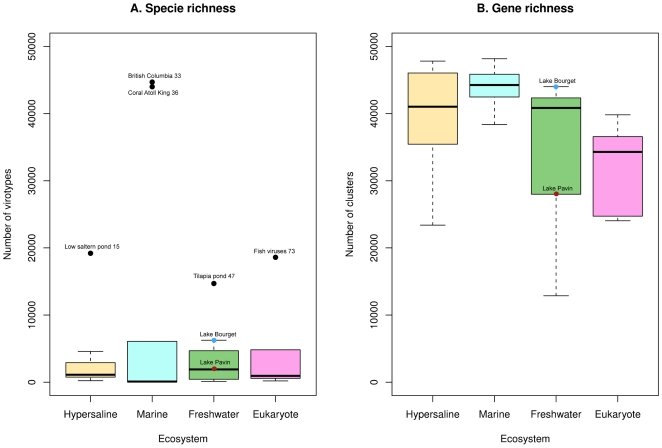
Figure 2. Boxplots of the estimation of species and cluster richness for viromes from different origins.
Species richness (A) was estimated with PHACCS for virome subsamples (50,000 sequences, 100 bp). Cluster richness (B) was deduced from the number of different clusters formed from 50,000 input sequences of 100 bp. Viromes associated with extreme points are indicated on the plot, as well as the viromes from Lakes Bourget and Pavin.

