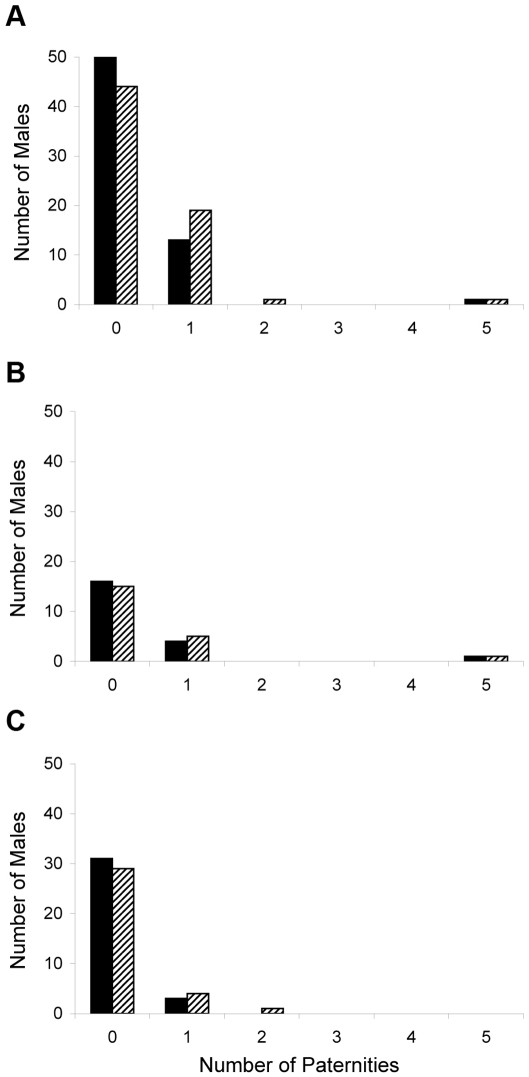
Figure 2. Distribution of cumulative male reproductive success.
Bars represent the number of paternities assigned over a three year period to each of a) 65 territorial males on San Jorge including males both within the study site and along adjacent areas and b) 21 territorial males on San Jorge including only those males within the study site, and c) the number of paternities assigned over a two year period to each of 35 territorial males on Los Islotes. Solid bars include only those paternities where the father was identified at the rookery the year of conception, whereas hatched bars include all paternity assignments.

