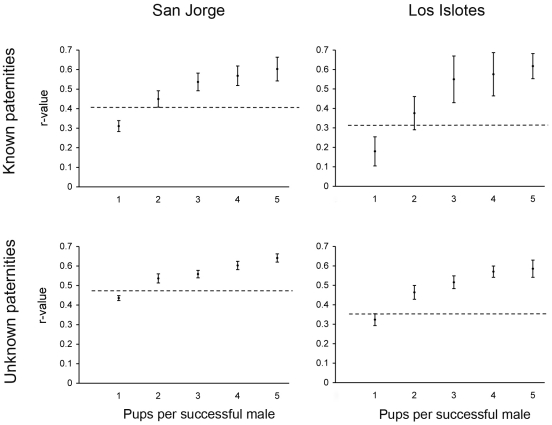
Figure 3. Observed paternal relatedness compared with expected values over a range of polygyny levels.
Expected values of average paternal relatedness (r-values) between pups if each successful male sires 1, 2, 3, 4 or 5 pups. Error bars represent +/− one standard deviation. Horizontal lines represent the observed r-values for each pool of sampled pups. At each of the two rookeries, separate analyses were done for pups that were assigned fathers (known paternities) and pups whose fathers could not be assigned (unknown paternities). In all cases observed r-values fall between what would be expected if each successful male sired just one or two pups.

