Figure 4.

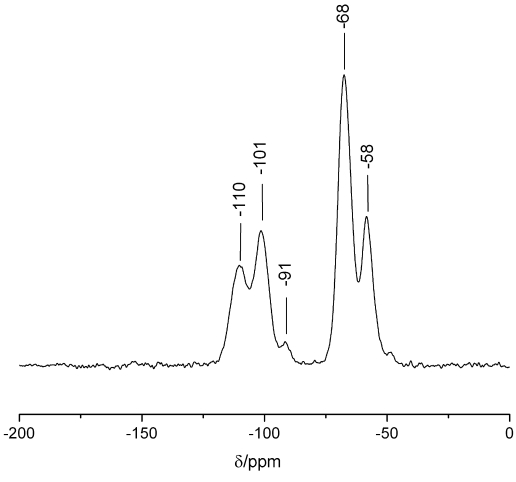
29Si CP-MAS NMR spectrum of SAB. Peaks at −110, −101, −91, −68, and −58 ppm were assigned to the Q4 (Si(OSi)4), Q3 (Si(OH)(OSi)3), Q2 (Si(OH)2(OSi)2), T3 (SiR(OSi)3), and T2 (Si(OH)R(OSi)2) sites, respectively.

29Si CP-MAS NMR spectrum of SAB. Peaks at −110, −101, −91, −68, and −58 ppm were assigned to the Q4 (Si(OSi)4), Q3 (Si(OH)(OSi)3), Q2 (Si(OH)2(OSi)2), T3 (SiR(OSi)3), and T2 (Si(OH)R(OSi)2) sites, respectively.