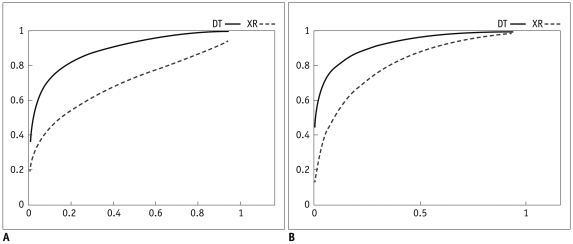
Fig. 3.
Receiver operator characteristic curve (ROC curve) from radiography (XR) and digital tomosynthesis (DT) for detection of paranasal sinusitis.
A. For observer 1, areas under curve (Az) are 0.700 and 0.891, respectively, for XR and DT (p < 0.05). B. For observer 2, Azs are 0.813 and 0.924, respectively, for XR and DT (p < 0.05).

