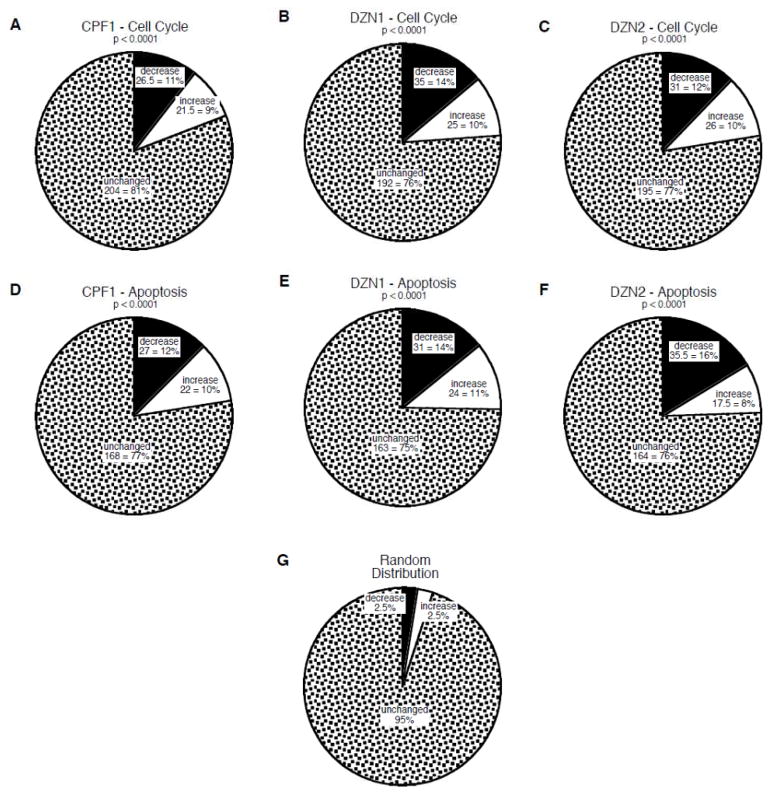
Figure 1.
Effects of in vivo organophosphate treatments on genes involved in cell cycle (A,B,C) and apoptosis (D,E,F): CPF1 = 1 mg/kg chlorpyrifos (A,D); DZN1 = 1 mg/kg diazinon (C,E); DZN2 = 2 mg/kg diazinon (C,F). Charts show the number and percent of genes in each category that were unchanged, or that showed significant increases or decreases from control values. P-values for each chart compare the distribution of values from those expected at random (G).

