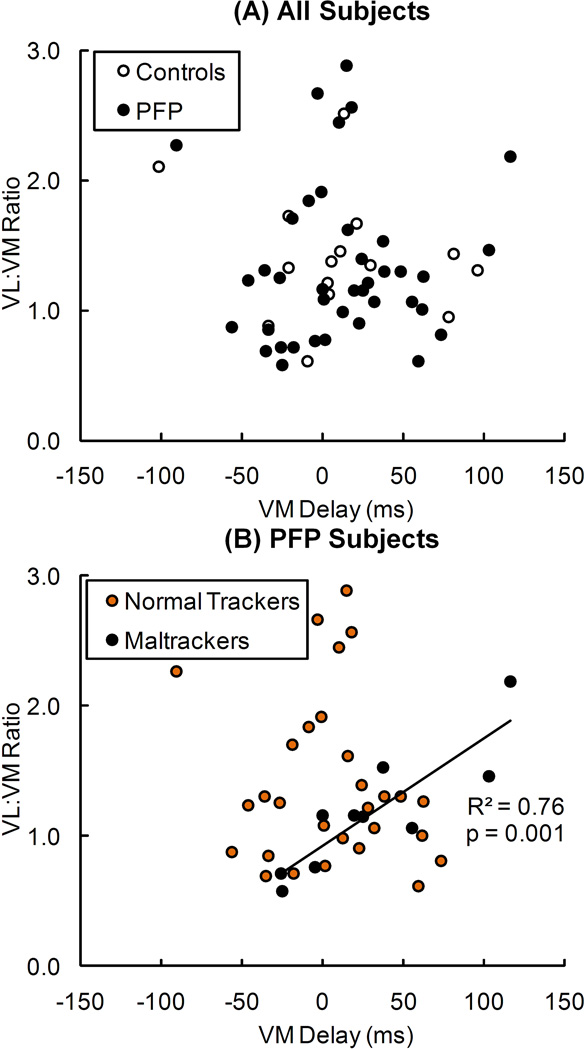
Figure 5.
Relationship between VL:VM activation ratio and VM activation delay in (A) pain-free controls and all PF pain (PFP) subjects, and (B) PFP subjects classified into normal tracking and maltracking groups. The regression line represents a significant relationship (R2 = 0.76, p = 0.001) in maltracking PFP subjects. No significant relationships existed between VL:VM activation ratio and VM activation delay in pain-free controls (R2 = 0.06, p = 0.399), all PFP subjects (R2 = 0.01, p = 0.548), or normal tracking PFP subjects (R2 = 0.01, p = 0.659).

