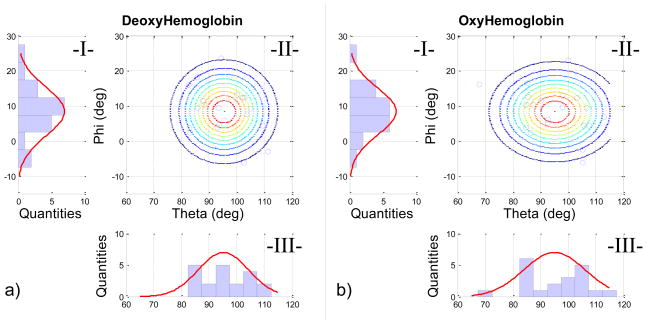
Figure 5.
Normal angular distribution for (a) HbR and (b) HbO for the 20 subjects. The 2-D angular distribution (II-a and II-b) is given by the normal distribution of elevation (red curve in I-a and I-b) and the normal distribution of the azimuth (red curve III-a and III-b). The lines in Fig. II-a and II-b are the iso-probability lines calculated; the blue circles represent the subject measurement.

