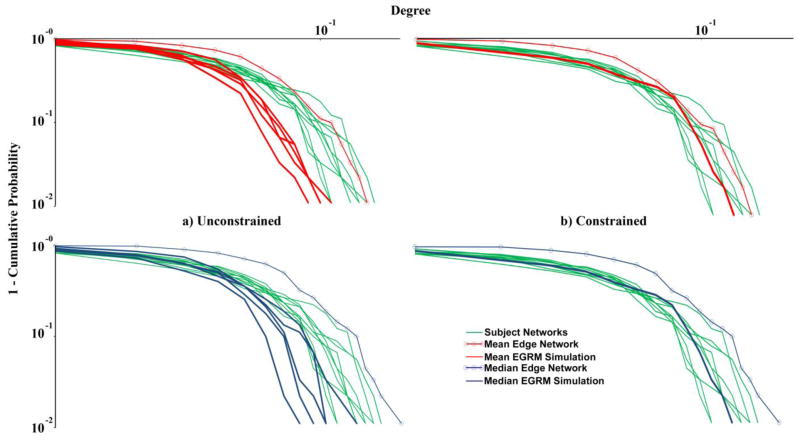
Fig. 3.
Degree distribution plots for the 10 subjects’ networks, the edge-based mean and median correlation networks, and a) the unconstrained mean ERGM and median ERGM simulation-based networks and b) the degree-constrained mean ERGM and median ERGM simulation-based networks. The upper panels show the mean networks and the lower panels the median networks.

