
Figure 2. Set-up of optical trapping experiments and sample data.
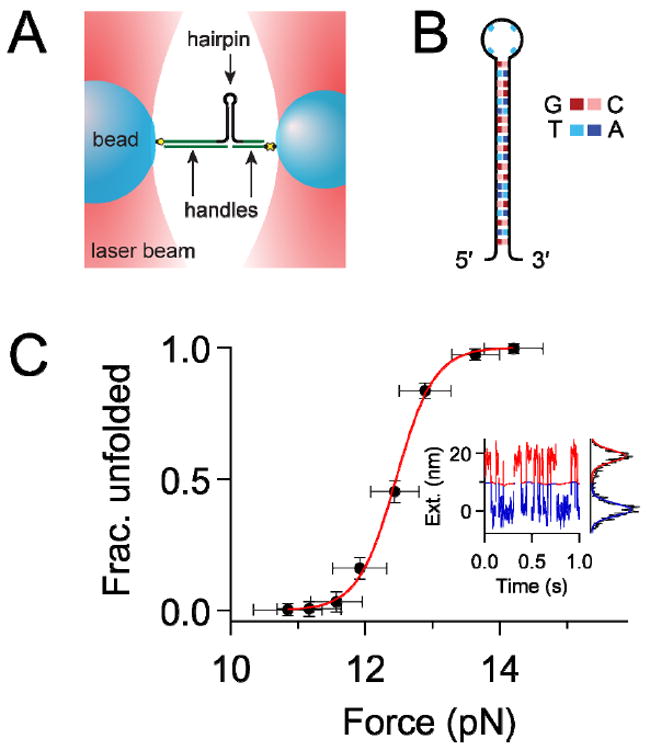
(A) Dumbbell single-molecule optical-trapping assay (not to scale). The DNA hairpin (black) was attached to two polystyrene beads (blue) through dsDNA handles (green) and specific chemical linkages (yellow). Each bead was held in a separate optical trap (red), and force was exerted on the hairpin by moving the traps apart. (B) The hairpin sequence used throughout this work. (C) Representative single-molecule data for a hairpin measured in 40 mM Na+. F1/2 was determined as the inflection point of a Boltzmann fit to the fraction of time in the unfolded state versus force. Inset, 1 s excerpt of the 10 s extension record corresponding to the point nearest to F1/2. The record was partitioned into the unfolded (red) and folded (blue) states, and a Gaussian function was fit to the histogram of points on each side of the partition. Δx (~18 nm) was determined as the distance between the peaks of the Gaussians.