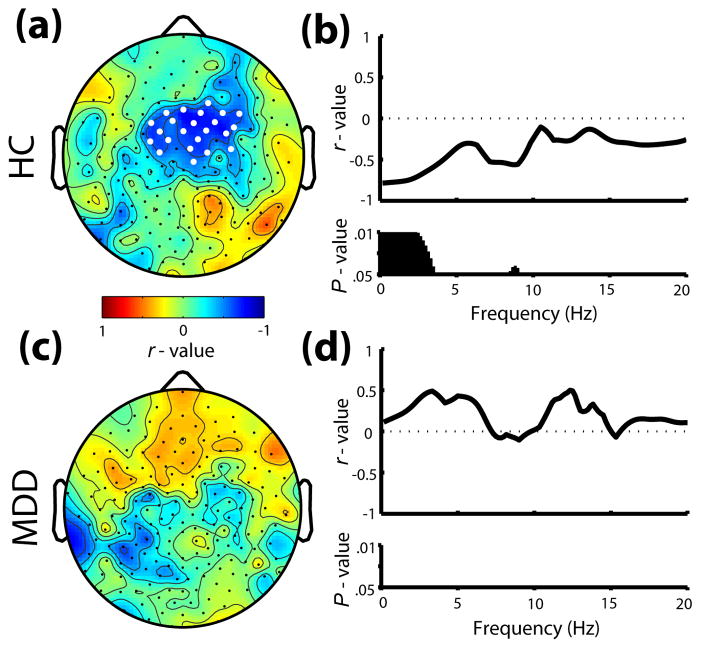
Fig. 3.
Relationship between overnight change (%) in N1 amplitude and average all-night sleep EEG power. (a) Topographic correlations (r – values) of N1 change with SWA (1–2.33Hz) at each channel for the HC group. White dots signify channels with P < .05. (b) Frequency-specific correlations from a representative fronto-central channel for HC. Black bars denote frequency bins with P < .05. (c,d) Same as in (a,b) for the MDD group.

