
Figure 1.
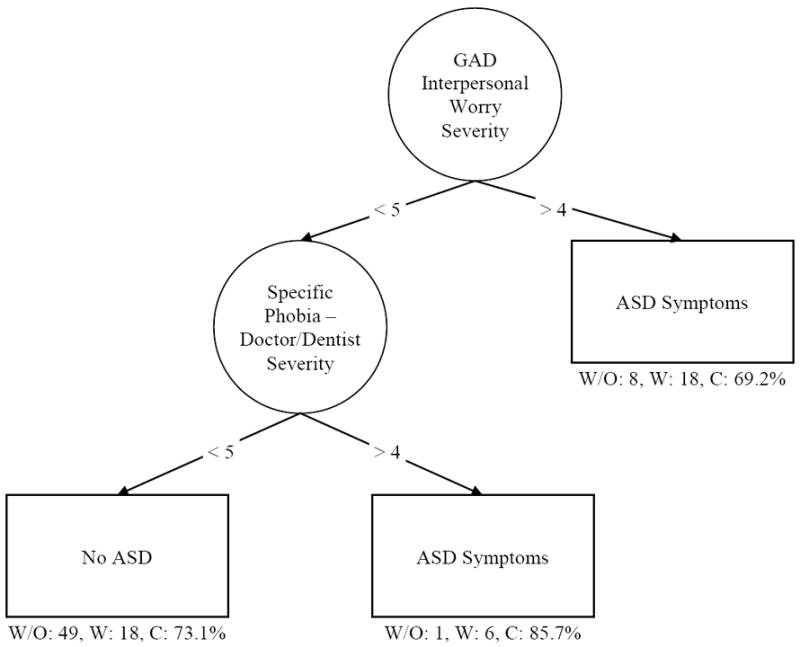
Final decision tree depicting the prediction of elevated or non-elevated levels of ASD symptoms. The model had a relative error = 0.64 and a cross validation error = 0.71 (SE = 0.11). Circles represent nodes and squares represent the outcome variable. Numbers on the lines represent the cut-points on the variables of interest that define the split (i.e., individuals whose score is > 4 on severity of interpersonal worry from the GAD section of the parent ADIS are split to the right, or the elevated ASD symptoms, side of the tree). Noted below each terminal node are the number of participants without elevated ASD symptoms (W/O), the number with elevated ASD symptoms (W), and the percentage of participants the tree classified correctly (C). Estimation was based on 100 participants and 398 variables.