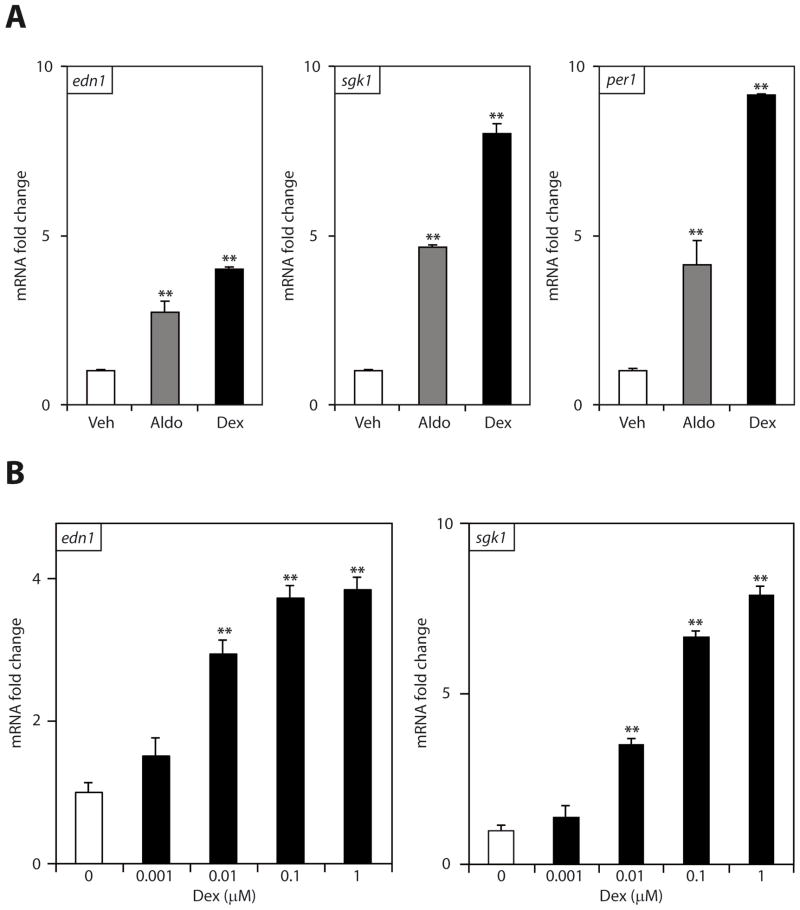
Figure 1.
Dexamethasone-stimulated gene expression in mIMCD-3 cells. Steady state Edn1, Sgk1 and Per1 mRNA was measured by QPCR, normalized to Actb (β-actin) and expressed as mRNA fold change relative to vehicle ± SE. (*p < 0.05, **p < 0.001 relative to vehicle; n ≥ 3) Panel A. Confluent monolayers of mIMCD-3 cells were treated with vehicle (veh, open bars) or 1 μM dexamethasone (dex, closed bars) for 1 h. As a positive control, cells were also treated with 1 μM aldosterone (aldo, gray bars) for 1 h and data are shown as a reference. Panel B. Cells were treated with dexamethasone concentrations ranging from 0 to 1 μM.

