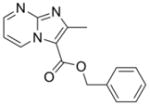
Table 1.
Activity of various heterocyclic scaffolds (1–14) against replicating Mtb H37Rv in various media, against non-replicating Mtb —LORA and cytotoxicity in VERO cells
| Compound | Mol. Wt. | Calc. ClogP* | MIC mean ±/− SD (μM) [MIC range] against replicating Mtb in medium: | LORA (μM) | VERO IC50 (μM) | ||
|---|---|---|---|---|---|---|---|
| GAS | GAST | 7H12 | |||||
 1 |
281.31 | 2.76 | 4.9 ± 1.7 [2.9–6.2] | 4.4 [5.7–3.7] | 16.6 ± 11.1 [3.8–24.0] | 63 | >128 |
 2 |
279.29 | 3.47 | 5.7± 2.3 [0.5–7.9] | 0.49 [<1–0.5] | 3.9± 1.0 [3.0–5.0] | 37 | 121 |
 3 |
278.31 | 3.70 | >65 [23.1–>128] | 59 | >40 [19.5–>50] | NT | NT |
 4 |
297.37 | 2.94 | 12.9± 4.8 [9.1–18.3] | 3.5 | 11.6± 5.1 [7.7–17.4] | NT | >128 |
 5 |
295.36 | 4.10 | 6.0± 4.0 [1.5–8.5] | 6.2 | 7.2± 3.0 [4.0–9.8] | NT | >128 |
 6 |
278.31 | 4.54 | 3.5± 1.4 [1.8–4.3] | >64 | >38 [15.0–>50] | NT | >128 |
 7 |
279.29 | 4.30 | 2.2± 1.0 [1.1–2.9] | NT | 0.8± 0.01 [0.7–0.8] | 28.0± 1.3 [26.9–29.4] | >50 |
 8 |
319.35 | 4.71 | 1.9±0.6 [1.5–2.5] | NT | 9.5±3.2 [5.8–11.9] | NT | NT |
 9 |
342.39 | 5.89 | <0.195 | NT | <0.195 | 21.7± 0.8 [21.1–22.6] | >50 |
 10 |
341.41 | 5.30 | 0.6±0.1 [0.5–0.7] | NT | 2.9±0.1 [2.8–3.0] | >50 | >50 |
 11 |
280.32 | 4.07 | <0.195 | NT | <0.195 | 34.8± 3.4 [31.3–38.2] | >50 |
 12 |
279.34 | 3.60 | 0.7 [0.4–1.1] | 2.0 [<0.5–3.4] | 2.3 [1.9–2.7] | 54 | >128 |
 13 |
267.28 | 2.40 | 2.3±0.5 [1.7–2.7] | NT | 4.7±1.1 [3.2–5.2] | NT | >50 |
 14 |
295.34 | 3.40 | 1.1±0.3 [0.9–1.4] | NT | 5.3±0.5 [5.0–5.9] | NT | >50 |
 Isoniazid (INH) |
137.14 | −0.67 | 0.22±0.01 [0.23–0.22] | NT | 0.37±0.12 [0.23–0.46] | >512 | >128 |
 Rifampin (RMP) |
822.94 | 6.04 | 0.09±0.01 [0.08–0.1] | 0.2 | 0.04±0.01 [0.03–0.05] | 2.6 | 113 |
Calculated ClogP by ChemDraw version 12.0; SD = standard deviation; MIC = Minimum Inhibitory Concentration required to inhibit the growth of 90% of organisms; NT = Not tested; GAS = Glycerol-alanine-salts media; GAST = Iron deficient glycerol-alanine-salts with Tween 80 media; 7H12 = 7H9 broth base media with BSA, casein hydrolysate, catalase, palmitic acid; LORA = Low oxygen recovery assay using the Mtb H37Rv luxAB luminescence strain; VERO = African green monkey kidney cell line to evaluate toxicity. Values reported are the average of three individual measurements.
