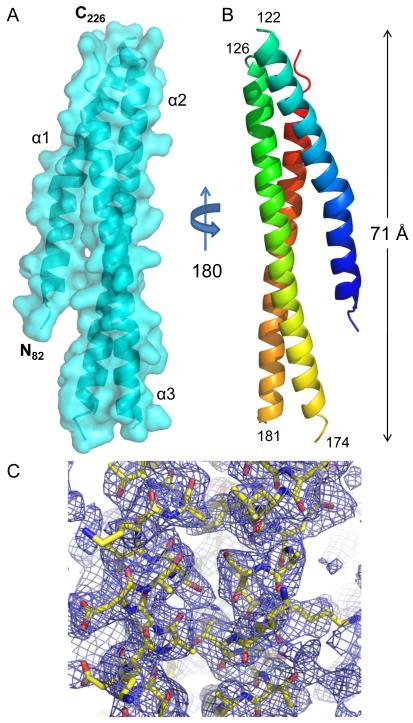
Fig. 2. Crystal Structure of SipB82.226 at 2.8 Å Resolution.
A, Crystal structure of S. Typhimurium SipB (residues 82-226) shown in cartoon ribbon format surrounded by surface representation (colored cyan). The electron density map corresponding to solvent exposed loop regions (i.e. residues 123-125 and 175-181) was too weak to model accurately. The start and end of each missing loop region is labeled in panel B. Four copies of SipB are found within the asymmetric unit (single copy shown for clarity). B, Crystal structure rotated 180° about the long axis; colored blue (N-terminus) to red (C-terminus). C, Representative model-to-map correlation for SipB82.226; 2Fo-Fc weighted electron density (contoured at 1.5 σ) is drawn as a blue cage around a region of the coiled-coil. Representations of all structures were generated using PyMol 46.

