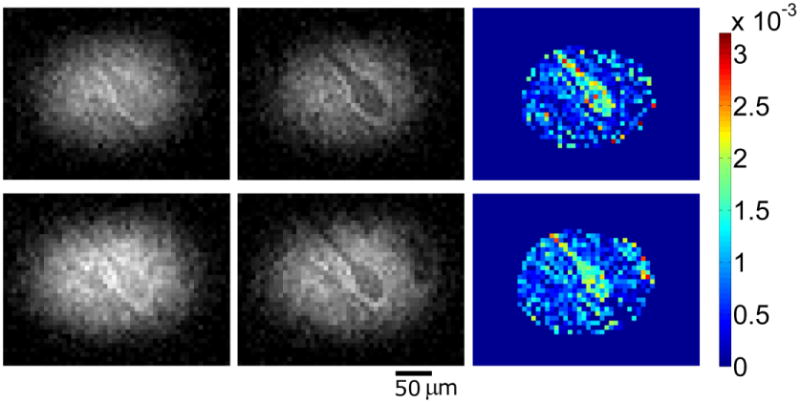
Figure 4. Representative scans from two diffusion-weighted, 3D datasets and their corresponding ADC maps.

Left to right by row (b = 300s/mm2; b = 600s/mm2; ADC map). Differences in apparent diffusion between visible structures belonging to an α-motor neuron and the remainder of gray matter tissue in the ventral horn which surrounds it are clearly demonstrated in raw data and the calculated ADC maps. Most notably, the ADC maps illustrate high apparent diffusivity inside the perikaryon and proximal axon of a porcine α-motor neuron relative to adjacent tissues. Colorbar units = mm2/s. SNR values (region surrounding motor neuron) top row: (left) 12.8 and (middle) 10.8; bottom row: (left) 17.0 and (middle) 13.9. CNR (between cell interior and surrounding tissues) top row: (left) 0.38 and (middle) 3.39; bottom row: (left) 1.42 and (middle) 3.86.
