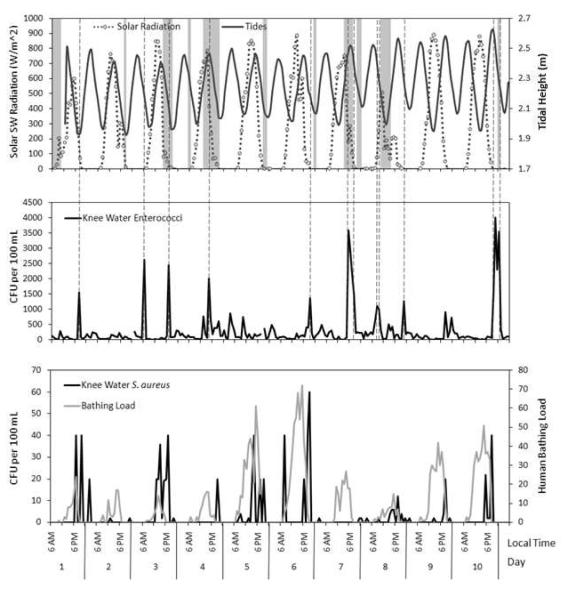
Figure 1.
Comparison of physical parameters knee depth water enterococci knee depth water S. aureus and bathing load. The top graph displays tidal height (dark grey line) solar shortwave (SW) radiation averaged over the previous hour (dotted line with data points) and times of rainfall (grey rectangles). The middle graph displays knee depth enterococci levels with dashed lines aligning peak enterococci events (>1000 CFU/100mL) to corresponding physical parameters. The bottom graph displays knee depth water S. aureus levels and number of bathers present at each hour.

