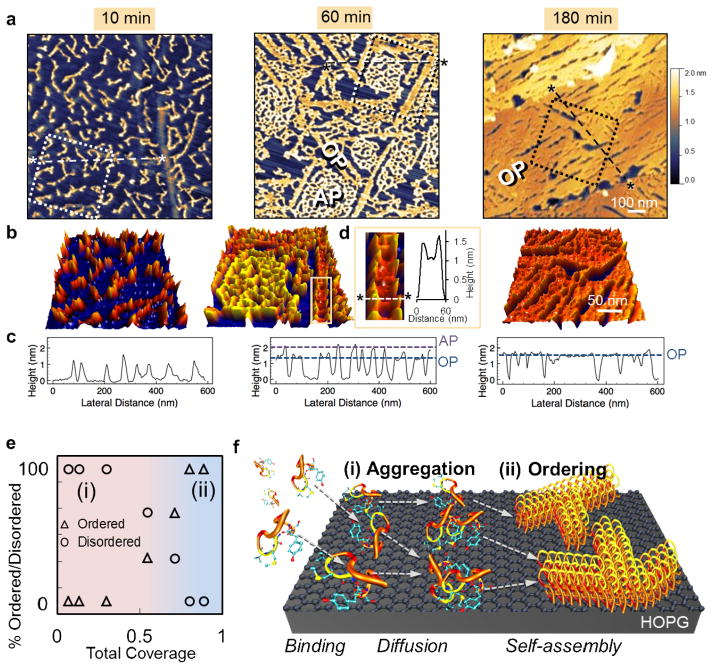
Figure 2.
Time-lapsed AFM of GrBP5 assembly. (a) Height contrast AFM images, for 10, 60 and 180 minutes, display structural evolution beginning with (left) discrete peptide clusters; (middle) growth of both amorphous (AP), and ordered (OP) phases as respectively labeled; and (right) complete OP monolayer. (b) Psuedo-3D representations of boxed regions showing height contrast among the phases formed: discrete (red), higher AP (yellow) and flat OP (orange), which are labeled below (c) on cross- sections of height taken across *---* in (a). Inset (d) shows lateral growth of OP including a cross sectional height taken between two peaks of AP peptides on either side. (e) Plot of percent total disordered/ordered peptide vs total coverage showing ordering transition and (f) Schematic of peptide self-assembly process highlighting surface phenomena: (i) Aggregation involving binding, diffusion, and clustering processes and (ii) Ordering involving self-assembly.

