Figure 7.

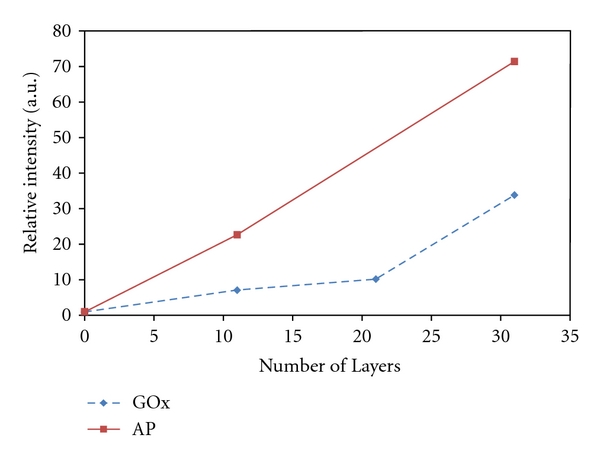
Plot of the relative intensity of chemiluminescent signal obtained from chips addressed with 0, 11, 21, and 31 layers of 200 nm biotin NPs and GOx-avidin or 0, 11, and 31 layers with streptavidin-AP.

Plot of the relative intensity of chemiluminescent signal obtained from chips addressed with 0, 11, 21, and 31 layers of 200 nm biotin NPs and GOx-avidin or 0, 11, and 31 layers with streptavidin-AP.