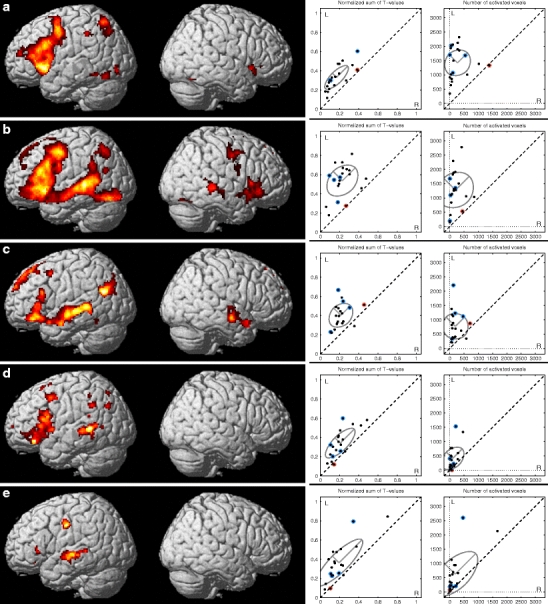
Fig. 1.

Group results of single tasks. a Word generation (WGEN), b responsive naming (RNAM), c sentence comprehension (SCOMP), d letter task (LET), and e word pair (WP). The results are presented using the threshold of p < 0.05 (FDR corrected). The scatter plots on the left are calculated as normalized sums of positive T values and on the right as number of activated voxels (p < 0.005, uncorrected) within the combined ROI for each task. The standard deviation ellipses visualize the group means (central point) and variations in activation power (2 × SD on major axis along the L = R line) and in lateralization (2 × SD on the other major axis, perpendicular to the L = R line). The non-right-handed subjects are highlighted in blue in the scatter plots. The red dot in the scatter plots highlights a subject with highly variable laterality according to the LI and visual inspection (subject #14)
