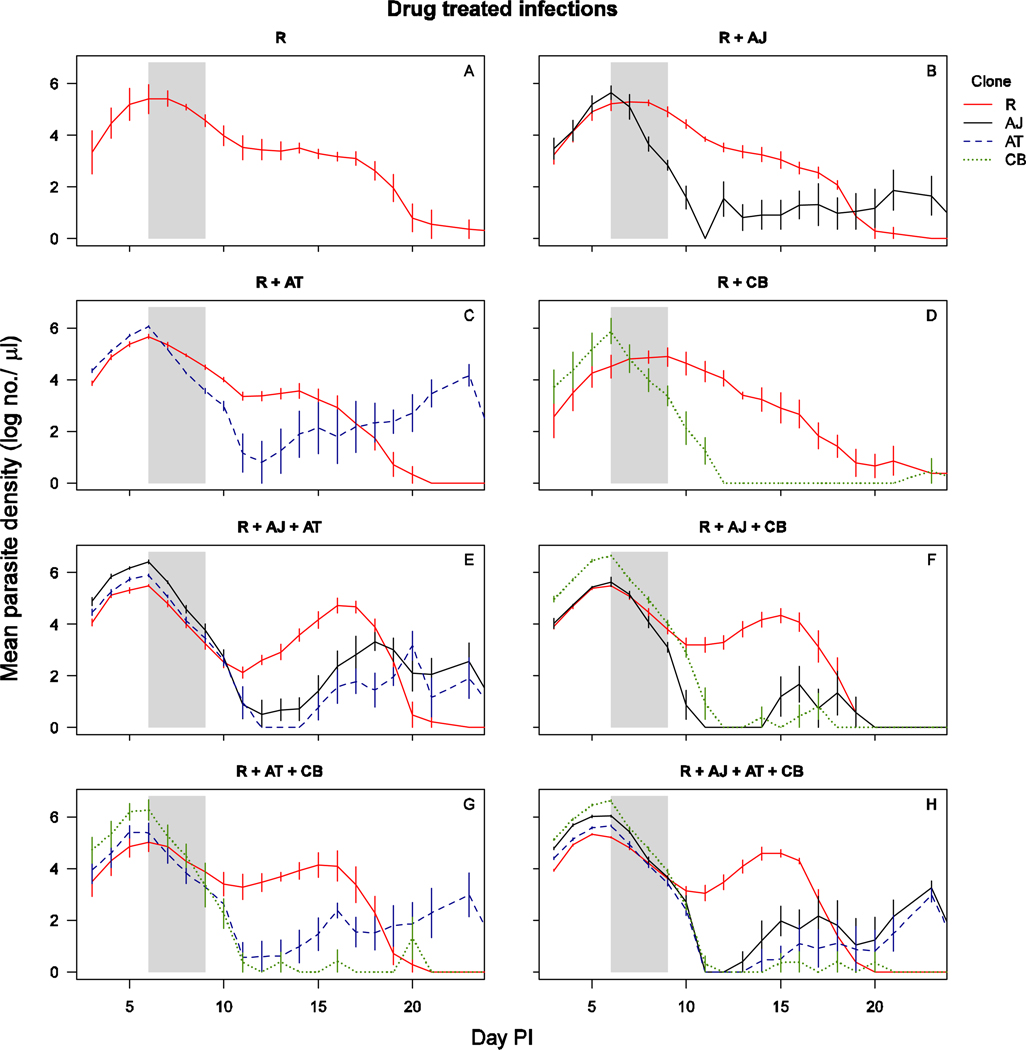
Figure 2.
Parasite dynamics of drug treated infections of clone(s): R alone (a), R with AJ (b), R with AT (c), R with CB (d), R with AJ and AT (e), R with AJ and CB (f), R with AT and CB (g), R with AJ, AT and CB (h). The total parasite densities for clone R are shown in solid red line, for clone AJ in solid black line, for clone AT in dashed blue line and for clone CB in dotted green line. Data are means (± standard error) of 5 mice (table 1). Drug treatment was given on days 6–9 post-infection, as indicated by the shaded area.

