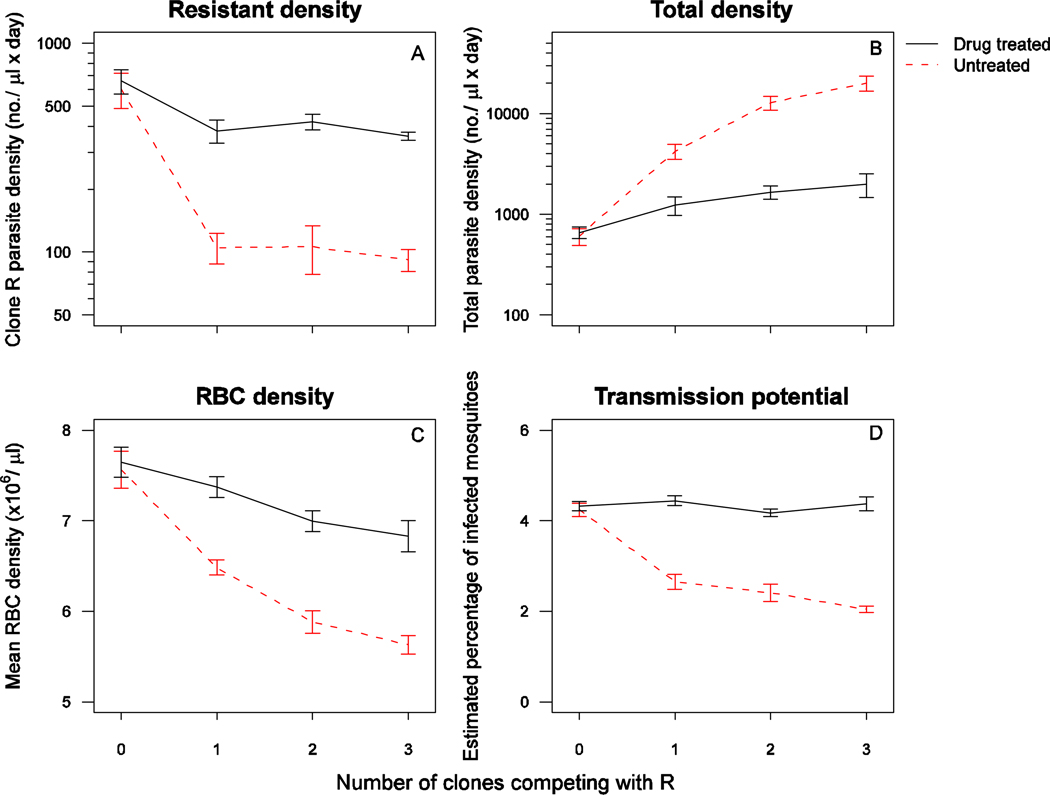
Figure 3.
Geometric mean daily parasite density of clone R (A), geometric mean daily total parasite density of all clones combined (B), mean daily red blood cell density (C) and estimated percentage of infected mosquitoes of clone R (D), in drug treated (solid black line) and untreated (dashed red 27 line) infections of either clone R alone (0 competing clones) or in a co-infection with 1, 2 or 3 other clones. Data are means (± standard error) for the entire infection period (panel A and C, day 3–35 PI), for the period with recorded susceptible parasite densities (panel B, day 323) or for the post-treatment period with gametocyte data (panel D, day 7–17). Note the y-axis varies between the left panel plots.

