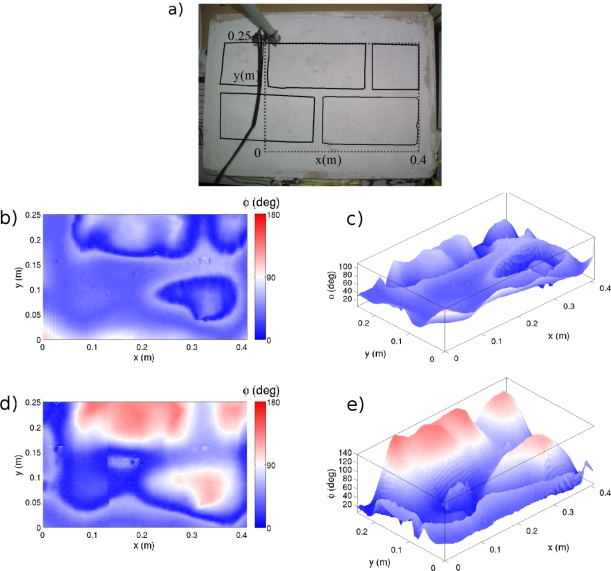
Figure 6.
Obtained results: (a) Image of the test specimen, where the dashed line marks the scanned area and the continues line depicts the limits of the bricks; (b) Two-dimensional representation of phase values measured at h = 1 mm; (c) Same results as in (b) represented three-dimensionally; (d) Two-dimensional representation of phase values measured at h = 2 mm; (e) Same results as in (d) represented three-dimensionally.

